April 2012
Sometimes the best answers aren’t right under your nose. For example, the most popular market indicator is home prices. But prices are what we call a lagging
indicator, because they reflect closed sales. Leading indicators are forward-looking. Watch activity related to list price received at sale, days on market and months supply of inventory to see how sellers might be regaining their pricing power.

Quick Facts
– 27.0%
Change in
Inventory
+ 2.1%
Change in
Closed Sales
+ 3.4%
Change in
Median Sales Price
Favorable supply-demand trends may be ticking away from the buyer for the first time in years. Moral of the story: Price is but a single picture in the gallery. New Listings in the Charleston region decreased 2.9 percent to 1,489. Pending Sales were up 44.4 percent to 1,245. Inventory levels shrank 27.0 percent to 6,572 units. Prices enjoyed a boost.
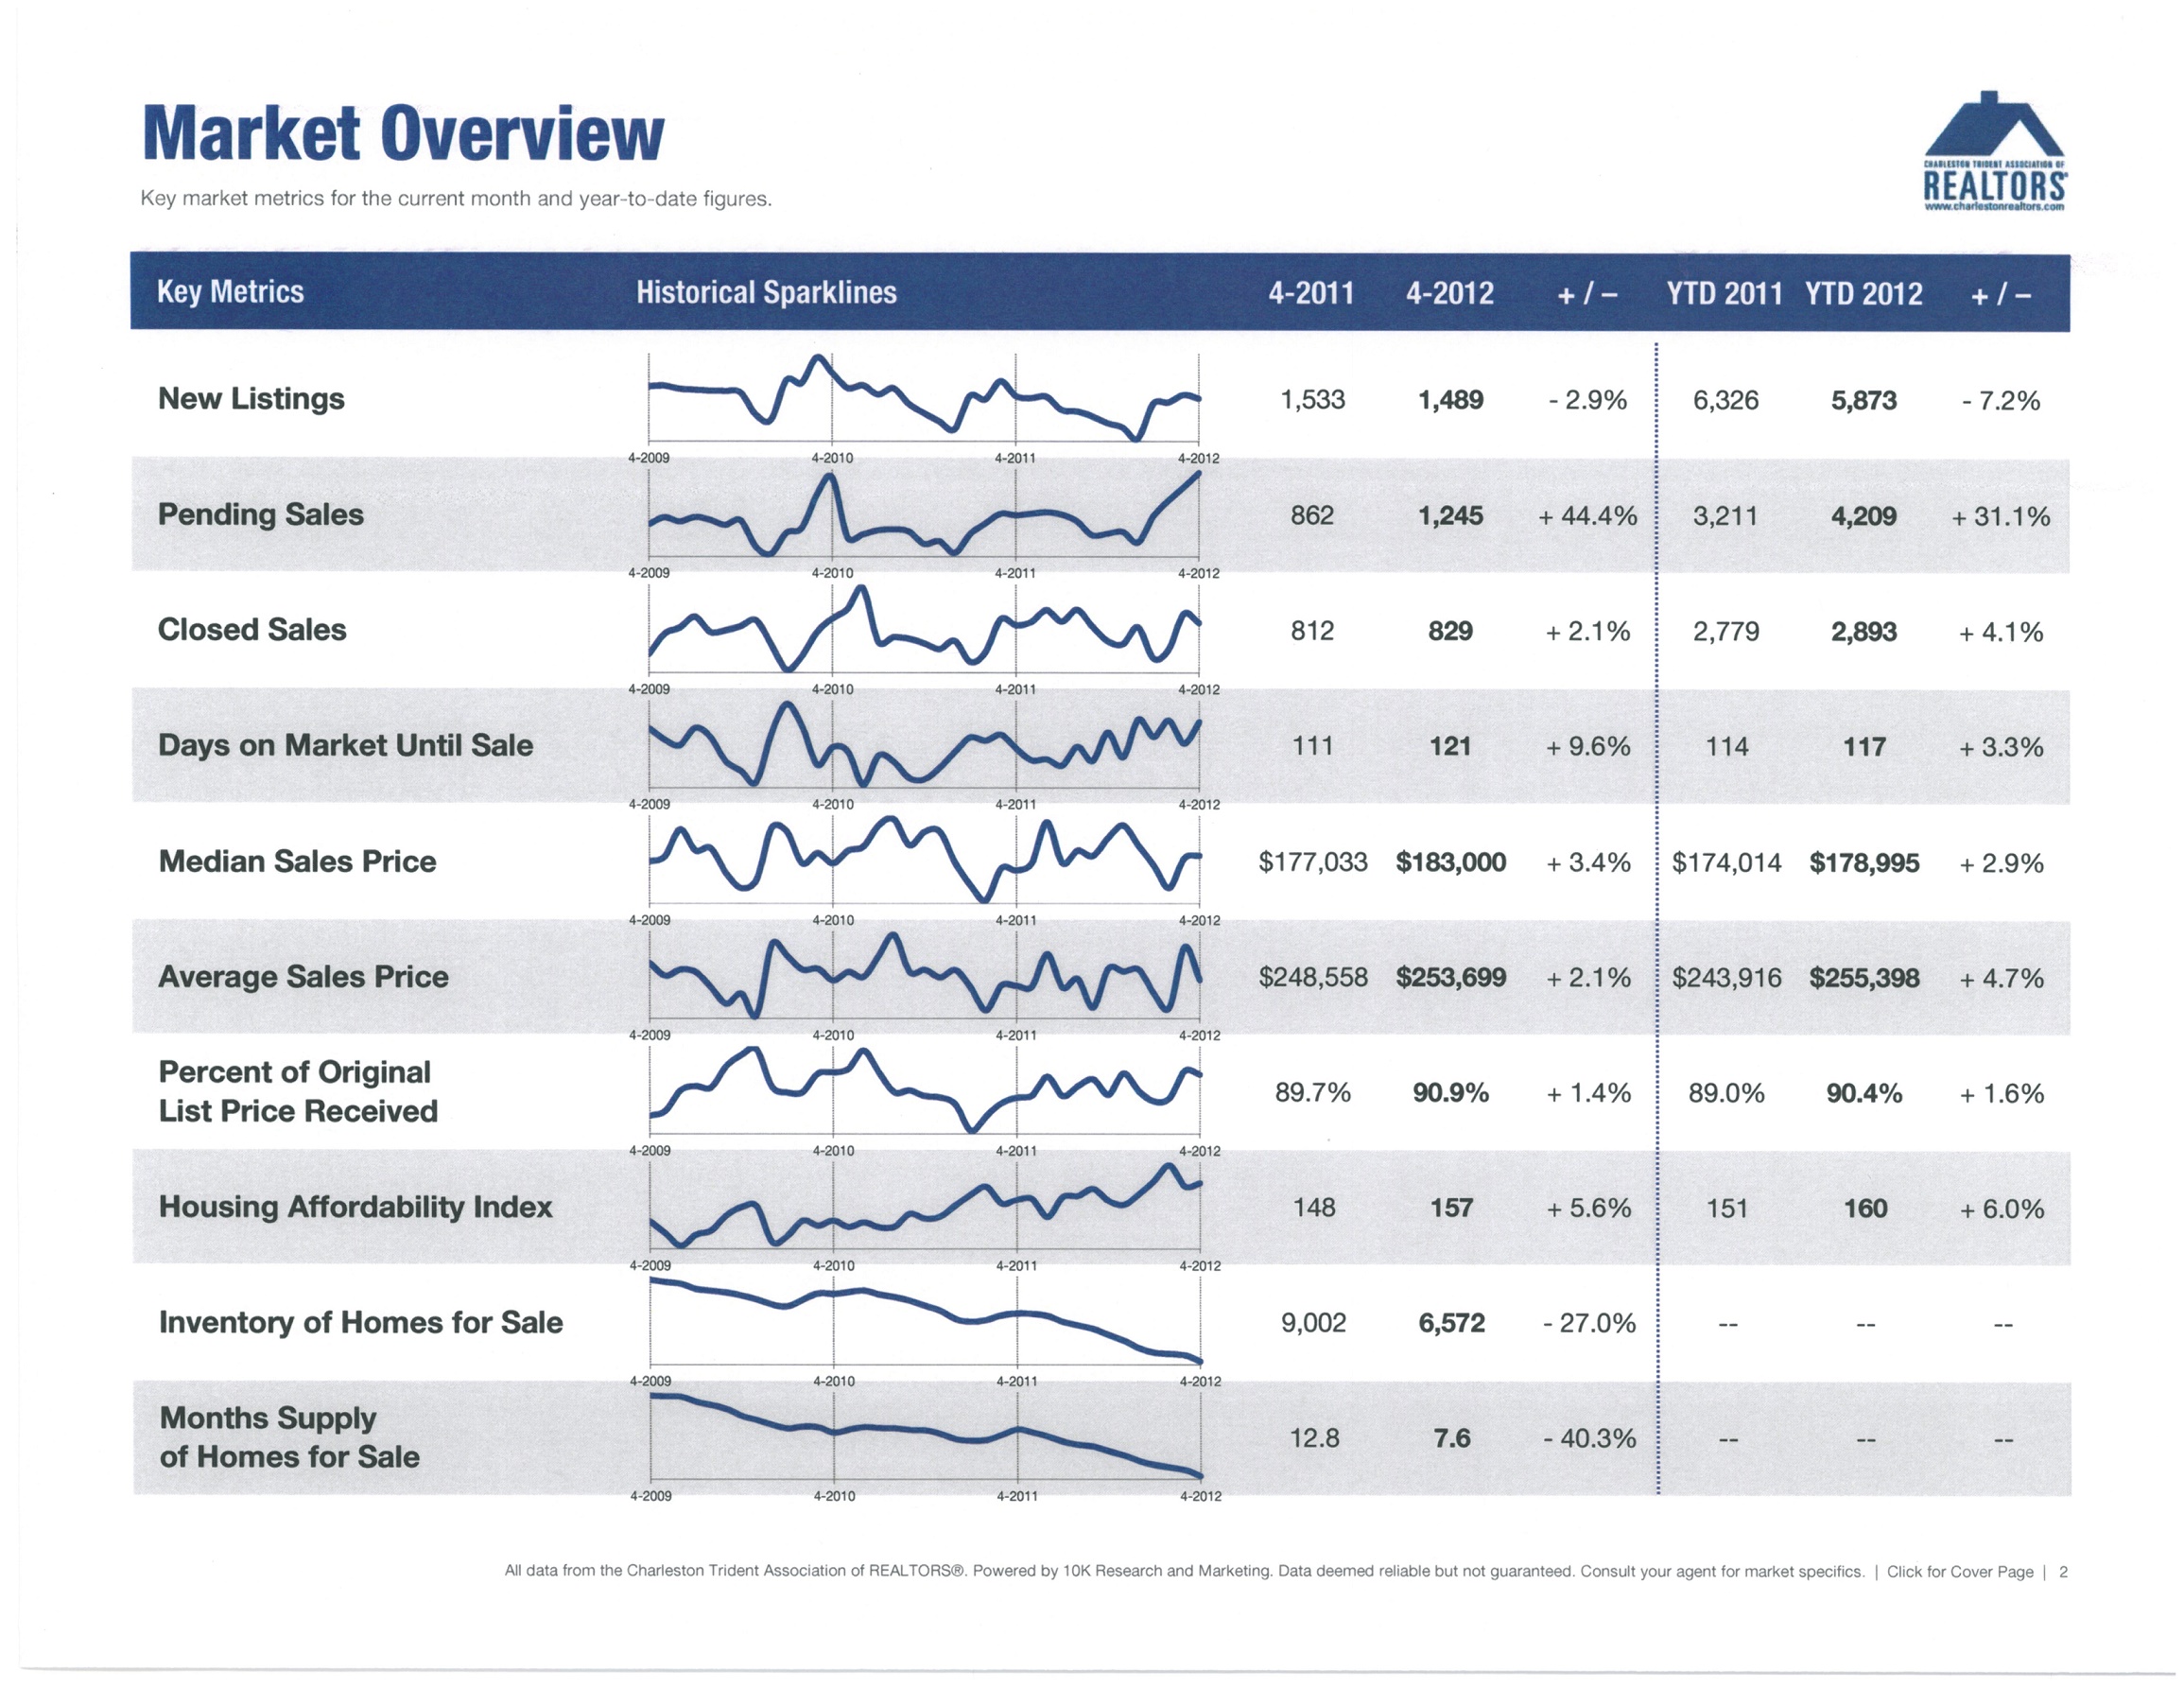
The Median Sales Price increased 3.4 percent to $183,000. Days on Market was up 9.6 percent to 121 days. The supply-demand balance stabilized as Months Supply of Inventory was down 40.3 percent to 7.6 months. When monitoring residential real estate activity, it is always important to keep tabs on the overall economy and job growth.
Preliminary Q1-2012 GDP growth came in at 2.2 percent, which, while disappointing to some observers and slower than Q4- 2011, still signals economic expansion and not contraction. Expedited bank processing and easing lending standards are also encouraging developments.